Soil Color
Used to distinguish adjacent horizons, in soil classification and as an indicator of internal water drainage. Color is measured in reference to a standard set of color chips (Munsell Color Book). There are three parameters.
Hue
Dominant spectral color
Value
Relative blackness or whiteness
Chroma Amount
of pigment mixed with gray value
Typical interpretation of soil color
Brown and black
Organic matter
Red
Hematite Associated with good drainage and aeration
Yellow
Goethite Moderate drainage and aeration
Gray
Fe2+
Poor drainage and aeration
Green and blue
Gley
Extremely poor drainage and aeration.
White
CaCO3
Mottling Varied colors of peds
No mottles
Good drainage and aeration
Yellow and gray
Moderate
Gray and bluish
Very poor
Soil Texture
Proportion of different size particles in a soil. USDA classification system:
< 1.00 mm very
coarse sand 2.00 mm
< 0.50
coarse
1.00
< 0.25
medium
0.50
< 0.10
fine
0.25
< 0.05
very fine
0.10
< 0.002 silt 0.050
clay 0.002
Coarse fragments are > 2 mm.
Surface area of soil separates per unit
mass or volume increases with decreasing size. As surface area increases
water holding capacity, organic matter content, adsorption of nutrients,
rate of mineral weathering, coherence of particles and microbial activity
all tend to increase. However, drainage, aeration and ease of tillage
decrease.
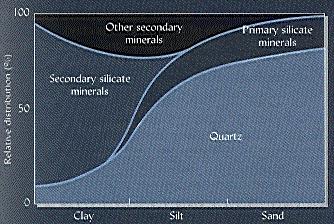
Composition of Soil Separates
Textural Classes

Textural triangle defines
the ranges of sand, silt
and clay for all 12 textural
classes.
Determination of Textural Class
Soil texture can be estimated by the feel method and precisely determined in the laboratory by a mechanical analysis. The latter may by the hydrometer or pipette method. In either case, a mechanical analysis is based on Stokes' law for the settling of spherical particles in a viscous fluid,
v = g(Ds - Dl)d2/18n
which shows that velocity of settling is proportional to the square of the particle diameter. So that if v is expressed in terms of distance per time,
t = 18nz/[g(Ds - Dl)d2]
one can determine t required for particles of diameter d to settle distance z. In the pipette method, therefore, a known mass of soil is suspended in known volume of solution and an aliquot above depth z removed after prescribed times. These aliquots contain only particles of diameter < d. For a settling depth of 10 cm,
Separate Minimum Size Approximate Time to Settle
Sand
d > 0.05 mm
< 1 minutes
Silt
d > 0.002 mm
8 hours
Complete particle size distribution (not just textural class) can be determined by series of such measurements, supplemented by sieve data for sand.
Since adsorbed cations such as Al3+, Ca2+, and H+ tend to flocculate small soil particles, these must be displaced by addition of an excess of Na+ which tends to disperse aggregates into discrete particles.
Soil texture may be considered a permanent
property of a soil since it is only slowly altered over long periods of
time by erosion, deposition, eluviation / illuviation, and
weathering.
Soil Structure
Structure refers to the grouping of soil particles into secondary bodies called aggregates or peds. Some soils, however, are structureless, either single grain, as with sands, or massive, as in some clays.
Types of structural units
Spherical Crumb
(high porosity)
Granular (low porosity)
Common at surface in soils with high organic matter
Platy
Occurs in surface and subsurface horizons
Prism
Columnar (tops of prismlike units rounded)
Prismatic (tops angular)
Subsurface
Blocky Angular
blocky (edges distinct)
Subangular blocky (edges rounded)
Subsurface
The field description of soil structure also includes relative size (class) and strength of cohesion (grade).
Structure affects water movement, aeration
and heat transfer. For example, infiltration decreases along the sequence
single grain, spherical > blocky, prismlike > platy, massive.
Development of Soil Structure
In the surface soil is related to the shrink-swell
behavior of certain clays and the adhesive effect of organic materials
from roots and soil microorganisms. The translocation of silicate clays,
oxides and salts affects structure development in the subsurface soil.
Soil Consistence
Term applied to resistance of soil to mechanical
stresses or manipulation. It is judged at different moisture contents.
Surface Aggregate Formation and Stability
Rainfall is conserved if the soil surface is well-aggregated because most water infiltrates the surface rather than runs off it. In turn, soil erosion is reduced and surface water quality preserved. Several factors are responsible for aggregate formation and stability. The adhesive action of organic matter and a dominance of flocculating cations favor aggregate formation and stability. Crop residues on the soil surface also protect aggregates from the disruptive effect of raindrop impact.
Destruction of surface aggregates, whether slaked by rain or broken, destabilized or crushed by tillage and traffic, tends to lead to the formation of a surface crust. Infiltration is slow and runoff fast when a crust covers the soil.
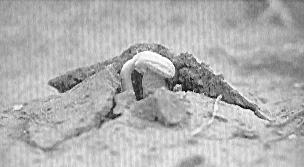
Soil crust.
Management of Soil Structure
Minimize tillage
Till under optimum moisture to avoid more
drastic impact, especially puddling
Keep residues on the soil to add organic
matter and protect the surface
Cover crops also add organic matter and
protect the surface
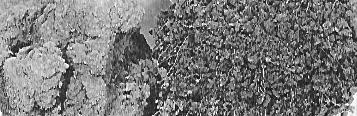
Puddled soil to left.
Particle Density
PD = mass soil solids / volume of soil solids (g cm-3)
Depends on the mineralogical composition
of soil but typically varies little (2.60 to 2.75 g cm-3 ) because
the range in density of common soil minerals is narrow. When particle density
is unknown, an average is 2.65 g cm-3 is assumed. The particle
density of organic matter is lower (0.9 to 1.3 g cm-3).
Bulk Density
BD = mass soil solids / total volume occupied by solids
Therefore, BD < PD. Methods for determining BD include removing a core of known volume or measuring the volume of a small excavation. In either case, the mass of solids is determined by weighing after soil water is evaporated (105 C).
Bulk density varies with texture, depth and management. From the standpoint of plant growth, high BD is not good because it restricts water movement and root penetration.
Higher in coarse textured soils because clay soils are generally aggregated. Therefore, clay soils exhibit not only macropores between aggregates but also micropores within aggregates.
Higher lower in the profile than at surface due to lower organic matter and greater compaction.
Higher in cultivated soils because cropping
tends to lower organic matter and decrease aggregation.
HFS and AFS
Hectare-furrow slice (HFS) is the
assumed mass of a hectare to depth of 15 cm,
2200 Mg. Acre-furrow slice (AFS)
is the assumed mass of an acre to depth of 6 in, 1000 tons.
Pore Space
Can be calculated from known PD and BD.
Vp = Vt - Vs
And since Vs = ms / PD and ms = BD Vt
Vp = Vt (1 - BD/ PD)
Or expressed as a fraction of total volume
Vp / Vt = 1 - BD/ PD
Clearly, pore space and bulk density are inversely related.
Not only is total porosity important for soil aeration and water movement, so too is pore size distribution. In particular, macropores allow good aeration and rapid water flow but micropores do not. Roughly defined, macropores 0.06 mm whereas micropores < 0.06 mm diameter. The distribution of pore sizes is affected by texture, structure and management.
Sandy soils largely contain macropores.
Clay soils also have intraaggregate macropores
and interaggregate micropores.
Cropping and tillage reduce organic matter
and pore space, especially macropores.
Conservation tillage limits or reverses
this effect.
Water Content
Gravimetric
mass of water / mass of soil solids
Volumetric
volume of water / volume of soil
Calculated using mass of water and density of water
(mw / Dw) / Vsoil
Air-dry moisture content
(mair-dry soil - moven-dry soil) / moven-dry soil
Expressed air-dry moisture as a fraction of the mass of soil solids